Python function to automatically transform skewed data in Pandas DataFrame
When I stumble on an interesting new dataset, I often find myself excitedly prototyping a quick machine learning models to see what type of insights I could get out of the latest find. Since hacking together a quick model can be fast thanks to plenty of awesome packages such as scikit-learn or Keras, I happen to spend most of my prototyping effort on cleaning and transforming the data. (I always like to start with the simplest regressors / classifiers)
To help speeding up the initial transformation pipe, I wrote a small general python function that takes a Pandas DataFrame and automatically transforms any column that exceed specified skewness. You can get it from my GitHub repo. Specifically, you’ll find these two python files:
skew_autotransform.py
TEST_skew_autotransform.py
The first file lets you import the skew_autotransform() function and use it in your project:
from skew_autotransform import skew_autotransform
skew_autotransform(DF, include = None, exclude = None, plot = False, threshold = 1, exp = False)
Feature Overview
- Analyzes all columns in Pandas DataFrame and transforms the data to improve skewness if the original skewness exceeds a specified threshold
- Allows you to specify which list of columns that should be processed or excluded
- Select between Box-Cox transformation or log / exponential transformation
- Recognizes positive / negative skewness and applies the appropriate transform (log / exp)
- Handles negative values
- Plots a “before and after” comparison of the data
Input parameters summary
- DF: Pandas DataFrame, mandatory
- threshold: skewness threshold, default value = 1, optional
- include: list of columns to process, optional
- exclude: list of columns to exclude, optional
- exp: If true, applies log / exponential transformation, the default value is False that applies Box-Cox transformation, optional
Example #1
Import the Boston housing dataset and apply Box-Cox transformation on any column that has an absolute value of skewness larger than 0.5:
import pandas as pd
import numpy as np
from sklearn.datasets import load_boston

from skew_autotransform import skew_autotransform

exampleDF = pd.DataFrame(load_boston()['data'], columns = load_boston()['feature_names'].tolist())

transformedDF = skew_autotransform(exampleDF.copy(deep=True), plot = True, exp = False, threshold = 0.5)

print('Original average skewness value was %2.2f' %(np.mean(abs(exampleDF.skew()))))
print('Average skewness after transformation is %2.2f' %(np.mean(abs(transformedDF.skew()))))
Output:
Couple samples of the Before and After histograms that are automatically generated for each column(out of 13):
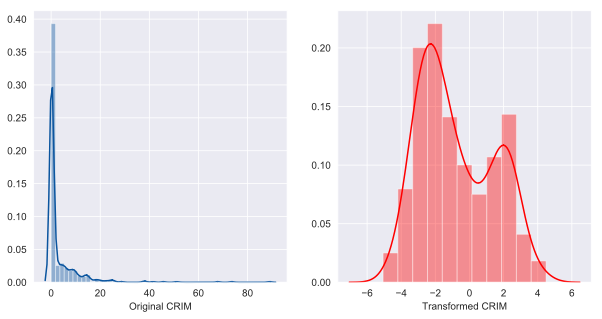

'CRIM' had 'positive' skewness of 5.22
Transformation yielded skewness of 0.41
------------------------------------------------------
'ZN' had 'positive' skewness of 2.23
Transformation yielded skewness of 1.10
------------------------------------------------------
NO TRANSFORMATION APPLIED FOR 'INDUS' . Skewness = 0.30
------------------------------------------------------
'CHAS' had 'positive' skewness of 3.41
Transformation yielded skewness of 3.41
------------------------------------------------------
'NOX' had 'positive' skewness of 0.73
Transformation yielded skewness of 0.36
------------------------------------------------------
NO TRANSFORMATION APPLIED FOR 'RM' . Skewness = 0.40
------------------------------------------------------
'AGE' had 'negative' skewness of -0.60
Transformation yielded skewness of 0.94
------------------------------------------------------
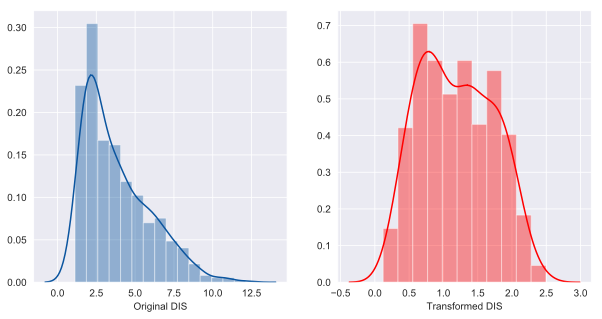
'DIS' had 'positive' skewness of 1.01
Transformation yielded skewness of 0.15
------------------------------------------------------
'RAD' had 'positive' skewness of 1.00
Transformation yielded skewness of 0.29
------------------------------------------------------
'TAX' had 'positive' skewness of 0.67
Transformation yielded skewness of 0.33
------------------------------------------------------
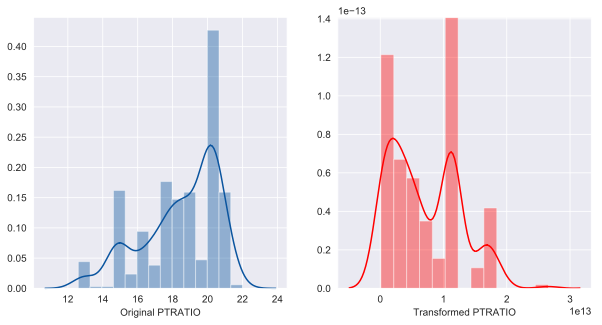
'PTRATIO' had 'negative' skewness of -0.80
Transformation yielded skewness of 0.52
------------------------------------------------------
'B' had 'negative' skewness of -2.89
Transformation yielded skewness of -1.13
------------------------------------------------------
'LSTAT' had 'positive' skewness of 0.91
Transformation yielded skewness of -0.32
------------------------------------------------------
Original average skewness value was 1.55
Average skewness after transformation is 0.74
Example #2
Import the Boston housing dataset and apply log and exponential transformation on any column that has an absolute value of skewness larger than 0.7. Exclude ‘B’ and ‘LSTAT’ column from the operation:
import pandas as pd
import numpy as np
from sklearn.datasets import load_boston

from skew_autotransform import skew_autotransform

exampleDF = pd.DataFrame(load_boston()['data'], columns = load_boston()['feature_names'].tolist())

transformedDF = skew_autotransform(exampleDF.copy(deep=True), plot = True,
                                   exp = True, threshold = 0.7, exclude = ['B','LSTAT'])

print('Original average skewness value was %2.2f' %(np.mean(abs(exampleDF.skew()))))
print('Average skewness after transformation is %2.2f' %(np.mean(abs(transformedDF.skew()))))
Output:
Couple samples of the Before and After histograms that are automatically generated for each column(out of 13):
------------------------------------------------------

 'CRIM' had 'positive' skewness of 5.22

 Transformation yielded skewness of 0.41

 ------------------------------------------------------

 'ZN' had 'positive' skewness of 2.23

 Transformation yielded skewness of 1.10

 ------------------------------------------------------

 NO TRANSFORMATION APPLIED FOR 'INDUS' . Skewness = 0.30

 ------------------------------------------------------

 'CHAS' had 'positive' skewness of 3.41

 Transformation yielded skewness of 3.41

 ------------------------------------------------------

 'NOX' had 'positive' skewness of 0.73

 Transformation yielded skewness of 0.36

 ------------------------------------------------------

 NO TRANSFORMATION APPLIED FOR 'RM' . Skewness = 0.40

 ------------------------------------------------------

 NO TRANSFORMATION APPLIED FOR 'AGE' . Skewness = -0.60

 ------------------------------------------------------

 'DIS' had 'positive' skewness of 1.01

 Transformation yielded skewness of 0.15

 ------------------------------------------------------

 'RAD' had 'positive' skewness of 1.00

 Transformation yielded skewness of 0.29

 ------------------------------------------------------

 NO TRANSFORMATION APPLIED FOR 'TAX' . Skewness = 0.6

 ------------------------------------------------------

 'PTRATIO' had 'negative' skewness of -0.80

 Transformation yielded skewness of 0.52


Original average skewness value was 1.55
Average skewness after transformation is 0.92
The examples demonstrate that both cases allowed me to improve the skewness of the data from 1.5 to a more reasonable 0.7 and 0.9 respectively using only two lines of code. While the function is not perfect, it is generally good enough for an initial prototype.
Note: I would recommend quickly checking which transformation works better for your specific dataset. The Box-Cox works well in most situations, but a log/exponential can return better results in some cases.
Enjoy!