Support Data Generator in Python
We’ve all been there - it’s Sunday evening, you have a couple of fresh ideas for a new customer centric strategy and you want to test how it would hold up in the real world. Unfortunately, it might be hard to get real or at least a somewhat realistic customer support ticket datasets for specific business models and company size.
If this issue plagues you on regular basis, head to this repository on my GitHub and download the following two python files:
main_generate_ticket_data.py
generate_daily_data.py
This code will allow you to input a few numeric parameters and quickly generate custom support ticket datasets that reflect what you could expect in real world business operations.
Feature Overview
- A python function to generate one year’s worth of support data with an arbitrary amount of records(call repeatedly for x years worth of data)
- Generate a varied, but statistically relevant number of support tickets for each day of the year
- Effects of business days vs weekends
- Capable of simulating the impact of an arbitrary number of busy seasons through the year(e.g. Christmas in retail or tax periods in accounting)
- Simulate a realistic, but easy to control, statistical distribution of logged time for each support ticket / case.
- Control the number of customer accounts to capture desired support volume vs customer base size
Input parameters summary
Daily ticket volume throughout the year controls:
- Seasonal peaks
- Weekend volumes
- Daily volume range (population mean, approximate min and max outliers)
Effort / logged time per ticket controls:
- Median
- Minimum logged time Advanced / Optional:
- Skewness factor
- Degrees of freedom
- Non-centrality (impacts variance and kurtosis)
Customer base controls:
- Number of unique accounts
Modelling daily tickets volumes throughout the year
The number of daily tickets is typically a random variable that has reasonably defined mean and variance. Moreover, the mean is likely to move throughout the year to reflect seasonal effects such as major holidays or annual business cycles. To model this behavior, the code is using a truncated normal continuous variable function from scipy package to generate the number of tickets on a given day:
#Calculate distribution function
dist = stats.truncnorm((annual_minimum - mu) / sigma, (annual_maximum - mu) / sigma, loc=mu, scale=sigma)
#Generate number of tickets for given day
ticket_num = int(dist.rvs())
Simply specify the approximate minimum and maximum number of cases per day throughout the year. The mean mu and variance sigma for any given day then will be automatically calculated based on the seasonal effect function:
#Calculate mean for given day
mu = (annual_maximum - annual_minimum)/2 + seasonal_factor * (busy_level - 0.5) *
	((annual_maximum - annual_minimum)/2)
#Calculate standard deviation for given day
sigma = (annual_maximum - annual_minimum) * 0.1
The seasonal effect requires tha you input the peak months as integer values. Here is an example for simulating two seasonal peaks in February and November: ‘busy_months = np.array([2,11])’
Moreover, input seasonal_factor (float <0,1>) allows you to control the magnitude of seasonal effects:
- 0 no seasonal effects
- 1 maximum seasonal effects
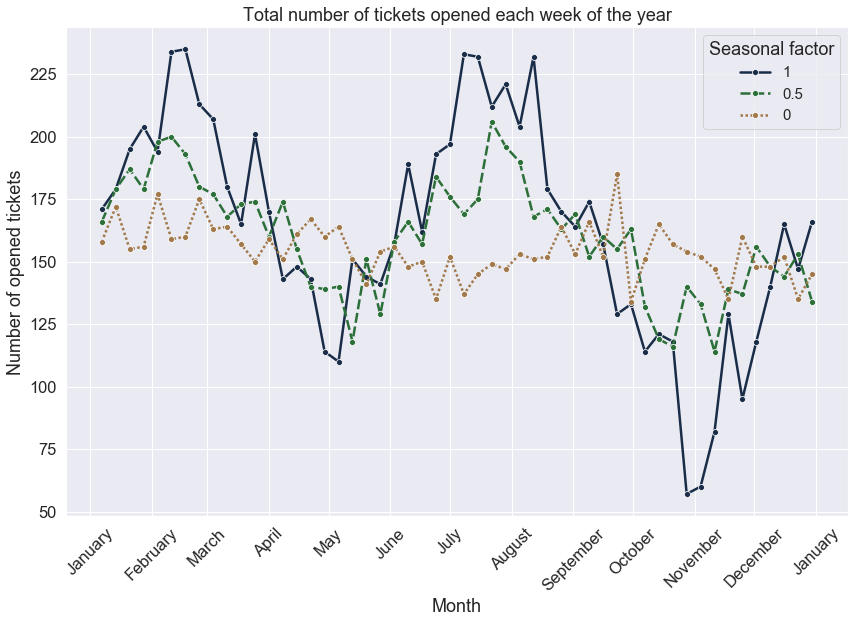
The following plot demonstrates the annual volumes and seasonality dependency with all other parameters being constant:
annual_minimum = 5		# ~ annual daily minimum of tickets
annual_maximum = 50		# ~ annual daily maximum of tickets
busy_months = np.array([2,7])	# February and July are busy months
Seasonal factor impact comparison:
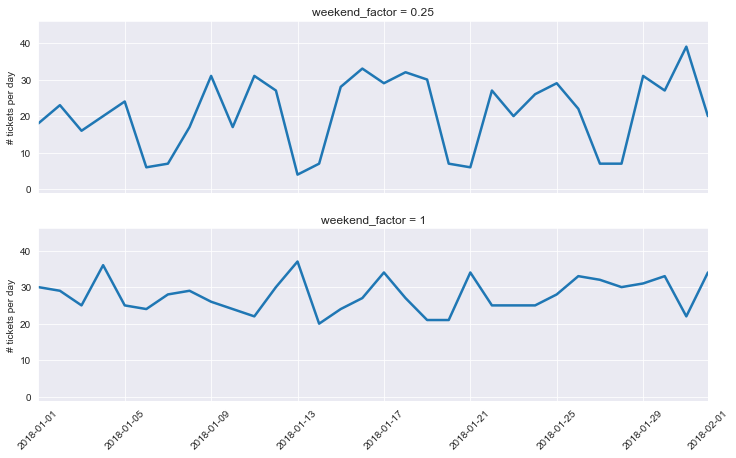
Impacts of weekends:
Weekends can have a major impact on your ticket volumes. This can be particularly pronounced if your company is B2B oriented and your clients are off work while having little to no impact if you are operating in a B2C model. To model this, select the appropriate value of the weekend_factor parameter (float - <0,1>):
- 0 - no ticket volume on weekends
- 1 - weekends are the same as business days
Modelling logged time for each opened ticket
Having an understanding of how much time is spent on each ticket is a crucial part of planning your operations. Unfortunately, this data cannot be easily simulated by a simple normal distribution function. While you will be able to find mean and variance in your real world data, you will also see few large outliers due to complex support problems resulting in a positive skew. Your systems and procedures are also likely to introduce a cut off limit on the low end - the minimum time spent on any opened ticket.
Fortunately, these effects can be quite well approximated by the non-central chi-squared distribution(Wikipedia) that can generalize the k - degrees of freedom defining the chi-squared function via the non-centrality parameter.
Probability Density Function(PDF) for the non-central chi-squared function:
Visualization of the non-central chi-squared PDF for various combinations of k and the non-central parameter(source en.wikipedia.com):
-pdf.png)
In the implemented python code, the logged time data is generated by function daily_data imported from generate_daily_data.py. This function is called by the main function with the following parameters:
Mandatory:
- size: automatically determined by the main function
- logged_time_median_desired: median logged time for the population in minutes
- Logged_time_minimum: minimum logged time in minutes
Optional:
- skewness_factor: [0,1] value; 0 for default chi^2 distribution; 1 for large positive skew
- k: degrees of freedom
- nonc: non-centrality (stats typically uses lambda letter)
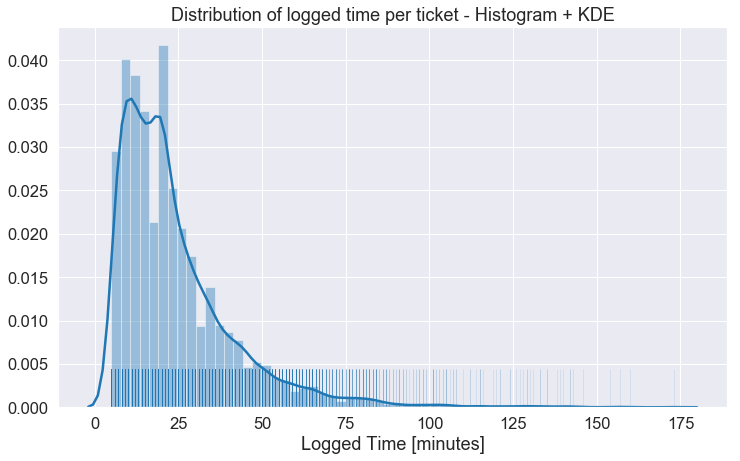
The following plot shows histogram and kernel density estimation(KDE) for a sample of logged time data containing approximately ~8000 tickets over 12 months with minimum time = 5minutes and desired median = 20 minutes.
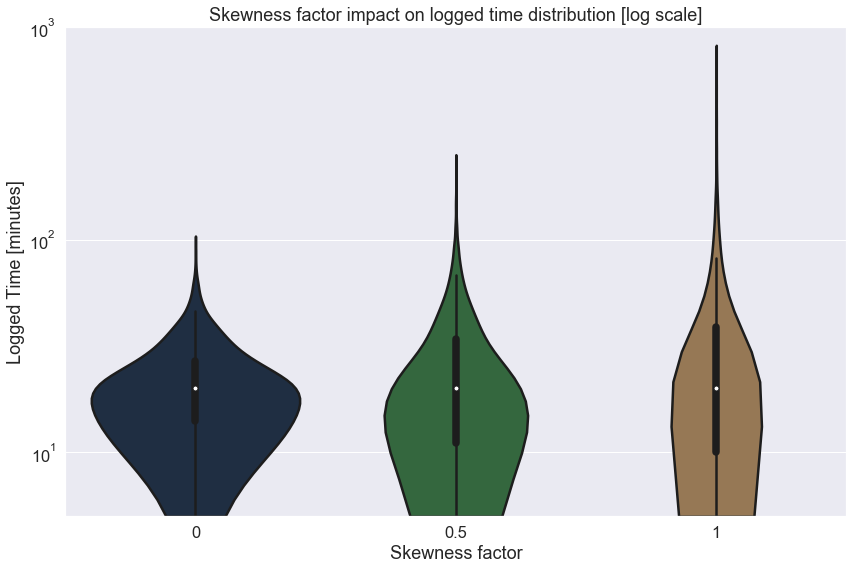
The same dataset was used to generate the next plot that compares the impact of skewness_factor while keeping all other parameters constant. Notice that the median does not change while the PDF does:
You can further fine-tune the distributions by adjusting any additonal parameters found in the Python script. That being said, the exposed input parameters addressed in this article should provide plenty of freedom to quickly model most bussiness scenarios and save you some time before you decide to dive into the actuall datamining to bring your idea to life.
You might be also interested in this article where the tool is used to generate general operations team workload data for demonstration of statistical team planning:
Use Statistics to Forecast Resource Allocation in Operations Teams

-pdf.png)